

A slightly edited version of this post was originally published in Morningstar.
The price to earnings ratio, or P/E ratio, is probably the most commonly used valuation metric in the stock market. It is a mathematical expression calculated by dividing a company’s current market value by the net profits of the current year.
- What are the factors that drive a company’s P/E?
A company’s P/E ratio is driven by a host of factors; the most important being:
- Earning visibility over the long run: Stable companies with a long runway tend to get a higher P/E multiple compared to cyclical companies. Bajaj Auto (business is cyclical in nature) will have a lower P/E compared to HUL (business with secular demand and almost zero seasonality). Don’t get fooled into believing that a lower P/E of Bajaj Auto makes it more attractive against a much higher P/E of HUL.
- Potential of Earnings Growth: Companies that have a higher potential to grow their earnings are worth more than companies that grow slowly or are stagnant. Bajaj Finance currently trades at more than 40x P/E compared to ONGC which trades at around 6x earnings. One of the reasons being that Bajaj Finance grew its net profit from Rs 898 cr (FY15) Rs 5,264 cr (FY20). During the same period, ONGC saw its profit decreased from Rs 18,334 cr to Rs 10,907 cr.
- Return on Equity (ROE): A business that compounds its capital at a higher rate will definitely be valued more. A higher ROE signifies just that as P/E has a positive correlation with ROE. (Check here and here to understand ROE in detail.)
- Debt: Any business with a lot of debt on its books is a fragile business running on the mercy of “other people’s money”. Such a business would definitely trade at a lower P/E compared to a debt-free company. Power Finance Company at a Debt: Equity Ratio of 12x trades at 3x earnings. Whereas CRISIL, a zero-debt company, trades at 40x earnings. Let’s look at firms within the same industry. KNR Construction trades at 12x earnings while PNC Infratech trades at 9x earnings. Over the past 5 years, the growth in revenue and profit of PNC is better than KNR, but KNR commands a higher valuation because of the strength of its balance sheet. As the cash generation ability of KNR is better than PNC, it resorts to lesser debt on books thereby earning a valuation premium.
- Market’s view on the industry or the company: The market tends to favour and overvalue a certain group of companies or sectors at different periods of time. It could be Cement (the early 90s), Infortech and Media (late 90s), Real Estate and Construction (2003-07), and FMCG (last 5 years). This changes the perception of the P/E ratio. Infosys, during the height of the IT mania in early 2000, was trading at a whopping 200x earnings. Today, after 20 years of relentless execution and phenomenal growth along with a huge scale, it trades at only 25x earnings.
- Dividends: Higher the dividend a company pays, the higher the market perceives its value to be. Some companies do make the mistake of paying out higher dividends than what is sustainable. However, companies that can manage to keep the dividend policy consistent, and increase the dividend payout ratio over time, get disproportionately favourable pricing from the market. Hence, their P/E ratio remains at an elevated level. However, there are exceptions to this rule.
- Interest Rates: Intrinsic value of any business or asset class is the sum of all the cash it can generate over its lifetime, discounted with the prevailing risk-free rate. The lower the discounting rate, the higher the value of the asset. Moreover, low-interest rates, like the one that is prevailing today all over the world, allow companies to secure credit /loans at cheaper rates. It helps them to grow faster. It moves the prices of those companies higher as investors anticipate better results in the future. Exactly the opposite happens when the interest rates are high.
Now, if we take two extreme examples from the NIFTY50 stocks, the concept of P/E will be more crystalized in our minds. At one end we have Nestle India, which ranks highly on all the above factors and hence trading at 75 times earnings. And on the other end, we have ONGC, which ranks poorly on almost all the above parameters except dividends, trading at a P/E of just 6.
SUBSCRIBE to our mailing list
- At what P/E ratio should one buy and at what should one sell?
That’s a very tricky one. Firstly, we must understand is that one cannot paint all the stocks with the same brush. And secondly, making a prediction on future P/E based on past performance is not going to yield satisfactory outcomes. Let us take a couple of examples from the NIFTY50 again.
Here’s the P/E Chart of ITC Ltd
Between 2010 and 2017, P/E of ITC continued to be above 30 most of the time. However, since June 2019, it has been consistently below 30. In fact, the median PE over the last one year is just 17. Hence, making a future prediction of ITC P/E in 2017 based on the last 7 to 10 years would not have worked out.
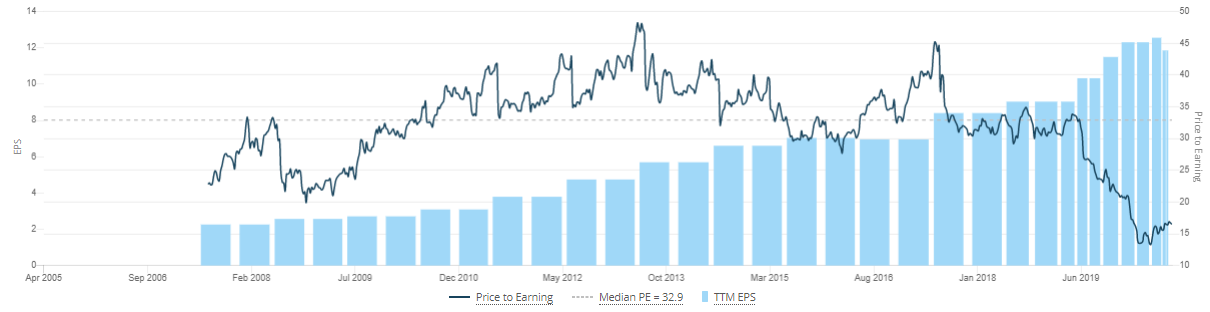
Now, let’s have a look at the P/E chart of Eicher Motors

Every market participant knows that Eicher Motors was a 100-bagger between 2009 and 2017. However, an interesting thing to note from the above chart is that the P/E of the stock has seen huge volatility in that period. An investor, to make outsized returns from the stock, had to hold the stock even when P/E kept on rising from as low as 10 times to as high as 60 to 70 times.
So, in short, forecasting P/E multiples is a very tall ask. Investors are better off not playing that game. Rather, if we ask the following questions and try to answer them, we have better odds of succeeding:
- How do I see the earnings growth from here over the next 2,3, or 5 years?
- What are the risks to the same?
- Does the current valuation overestimate or underestimate the growth in earnings?
- What can potentially change the perception of investors in favour of or against the company going forward?
Answers to the above questions are not perfect or accurate at any point in time. However, they prepare us better for making investment decisions.
Instead of extrapolating past PE data to make future predictions, PE can be used more effectively to gauge the market expectations for the company as compared to its direct competitors and industry segment.
For example, an industry leader will almost always have PE greater than its competitors or the industry median PE. If an industry leader PE is close to the industry median and it clearly has greater growth prospects than its competitors, then the earnings expectations of the company are clearly being underestimated and can be a source of potential returns in the future.
On the other hand, if the company has an unreasonably high PE as compared to its peer group and industry median without any clear edge or growth prospects over the competition then market expectations from the company may be overestimated and it would be risky to enter into it at the current moment.
- So does that mean that P/E cannot be forecasted with accuracy? Then why do we base our investment decision only on P/E?
We cannot treat P/E Ratio as the only base for thinking about buying or selling a stock. Moreover, we also have to admit to the fact that it is comparatively easier to think about the earning trajectory of a business than about the P/E ratio it will command. In the examples discussed, we have seen that there can be a broad range of P/E distribution in a 10-year period for any stock. Betting on the value of P/E is extremely difficult.
So, a useful process for all investors could be to think like this:
- If your investment horizon is less than 2-3 years: Be very conservative and buy stocks at the lower band of P/E over the last 10-15 years and bet on mean reversion.
- If your investment horizon is five years or more: Buy at a conservative P/E multiple based on the industry and the business. Track the earning potential of the company and continue to hold the stock until you see evidence of earnings growth tapering off.
It goes without saying that the above rules of valuation can only be applied if the company passes through your checklist on business quality, management strength, capital allocation track record, and industry dynamics.
And lastly, it is important to know that for some businesses the P/E ratio may not be the best measure for thinking about valuation. Financials and insurance are two such businesses. This could be another topic of discussion in the future.
Happy investing!
Disclaimer
This is not investment advice. Please read our terms and conditions.