
Return on Equity (ROE) is often hailed as the most important metric in judging the efficiency of a business. It is indeed an important metric. Legendary investors around the world have repeatedly highlighted ROE and its importance in investment decisions. One of the world’s most famous investors, Warren Buffett, has time and again expounded on the importance of ROE.
But the matter of fact is that very few new investors have a thorough understanding of ROE and its composition. So, the purpose of this piece of writing is to provide clarity on the concept of ROE and to lay down a practical framework as to how one should use the same to gain insights into the working of a business or an industry.
Simply put, ROE is a measure of profitability that calculates how many rupees of profit a company generates with each rupee of shareholders’ equity.
The formula for ROE is:

But the real meaning of ROE is not as simple as it appears from the above definition and formula. The famous and widely used DuPont Framework brings out a clearer picture of the ROE. It measures and articulates three important tasks of corporate management:
1 Profitability
2 Asset Management
3 Financial Leverage
The DuPont Formula further breaks the ROE formula into three parts/levers as follows:
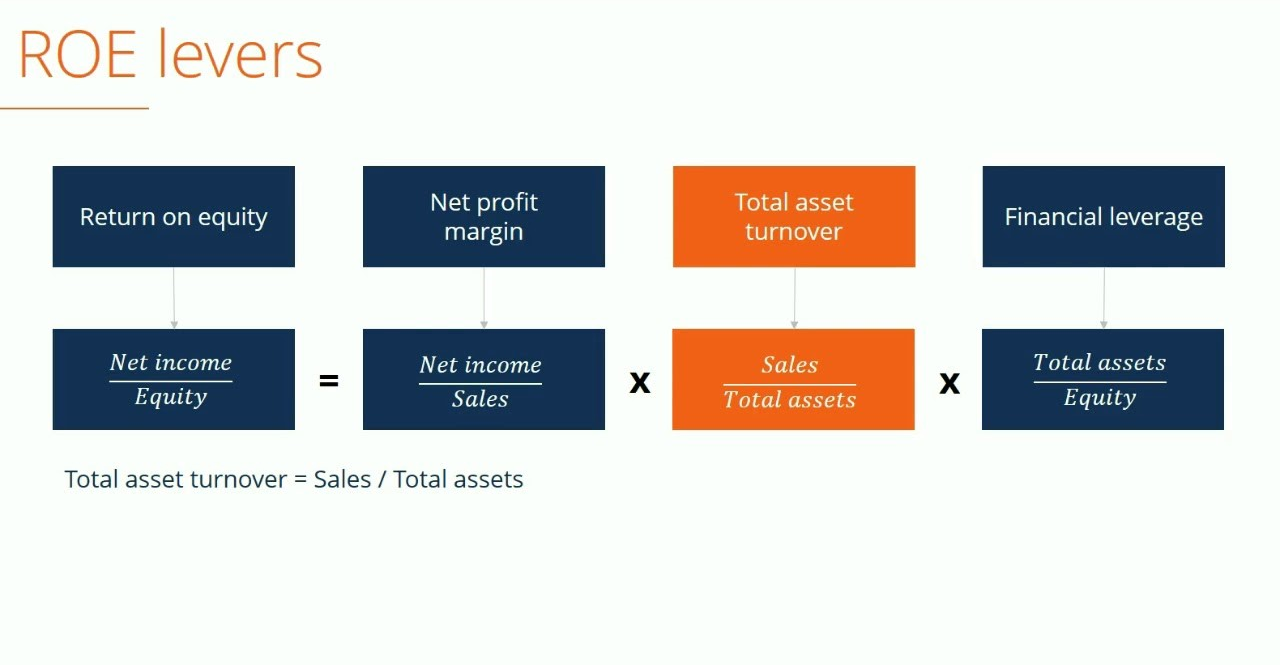
So, now we can see that three different metrics lead to the value of ROE. The same are as follows:
1 Net Profit Margin
2 Asset Turnover
3 Financial Leverage
Thus, rather than just looking at the blanket rate of ROE, we must be willing to dig in further and decompose the formula in order to gain insight as to which of the above three metrics contribute the most in the formation of ROE and what is the implication of that. Hence, ROE is not only a measure of how much returns a company generates on its equity, but also how effectively management is running the corporation. It focuses not only on the management’s ability to generate high margins but also on its ability to allocate capital efficiently for the best results. Now, let us look at each metric at a time.
Net Profit Margin
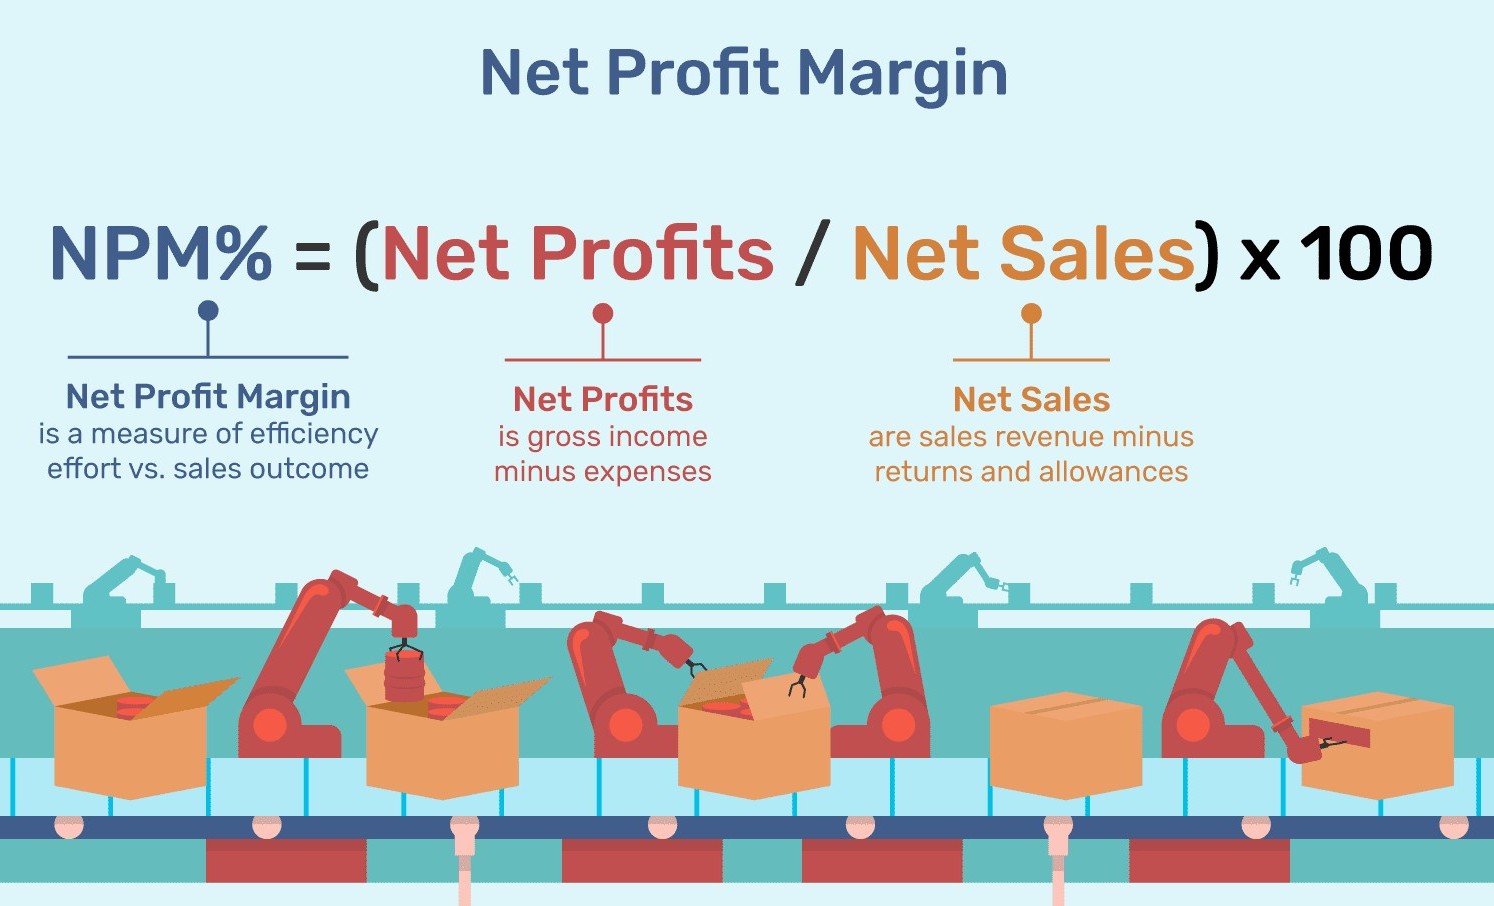
Pricing a product to generate profits and business volumes is of prime importance to any business. A business with high margins is one where the owner has an ability to charge higher prices. Hence, such companies have an inherent advantage which may be the result of:
- habitual use of the product,
- the high cost of switching to the new product,
- the high cost of searching for new products
This gives a competitive advantage to the company, and in effect, it can charge higher prices compared to its competitors and it will show in the financials as the profit margins will go up.
Asset Turnover
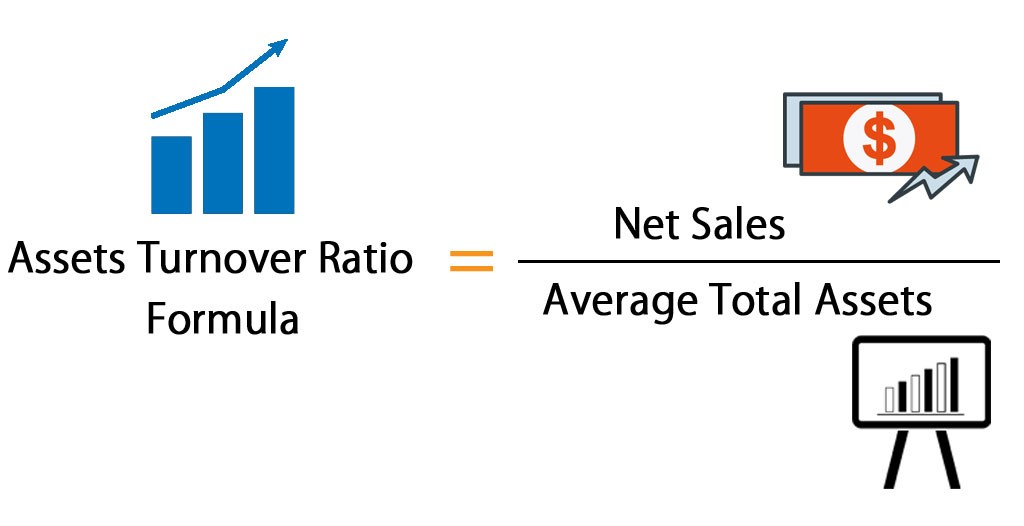
Observing the asset management ability of the company, from the point of view of its contribution to the total return on equity, allows an investor to compare this ability of the company with its other core abilities to generate margins and creating financial leverage. This, in turn, helps an investor to discern whether it’s a great business or a gruesome one. Investor community puts too much weight on the company’s ability to generate high margins, but often it is the high asset turnover rate which proves to be the deciding factor for the company. By having a high asset turnover, the company is in effect in an asset-light model which requires very little incremental capital to fund its growth. Hence odds of those companies with high asset turnovers are better than those with high margin but very low asset turnover.
Just as pricing power comes from consumer advantage, a high asset turnover is the result of production advantage. It means that there must be some inherent efficiency in the operating or production process of the company which makes it possible for the company to keep rotating the same amount of capital multiple times during the year to generate high asset turnover.
Financial Leverage
While the above two metrics look at the consumer and production angle, financial leverage is only concerned with the capital structure of the business. Businesses which enjoy financial leverage will invariably have higher ROE, but we must try to decipher what type of financial leverage does the company enjoys and what are the costs associated with it. Suppose a company manages a float in the nature of trade credits, deposit from distributors, and advance from customers or deferred tax liability, it effectively has temporary possession of Other People’s Money (OPM). A float of this nature is enduring, long term and cost-less. Thereby, the presence of this float allows the company to fund its assets without making a significant contribution in the form of equity or interest-bearing debts. Financial leverage in this form is advantageous for the company, as it levers ROA to produce a high return on capital employed. But, if the company enjoys financial leverage in the form of high interest-bearing debt, after a certain point, the actual cost of the debt diminishes profit margins and decreases asset turns.

The DuPont framework of calculating ROE into the above mentioned three components not only allows the investor to determine what kind of return on equity is being generated by a company but also to examine the quality of that return as well as which financial levers management is pulling to create it.
Now let us put this concept into practice and analyze the ROE of two companies as below:
| ROE – ASIAN PAINTS | ROE-BERGER PAINTS | ||||||
| Particulars (INR Cr) | 2017 | 2018 | 2019 | Particulars (INR Cr) | 2017 | 2018 | 2019 |
| PAT | 1939 | 2039 | 2160 | PAT | 474 | 461 | 498 |
| Opening Networth | 6525 | 7602 | 8848 | Opening Networth | 1562 | 1902 | 2195 |
| Closing Networth | 7602 | 8848 | 10050 | Closing Networth | 1902 | 2195 | 2376 |
| Average Networth | 7064 | 8225 | 9449 | Average Networth | 1732 | 2048.5 | 2285.5 |
| Sales | 15062 | 16825 | 19342 | Sales | 4552 | 5166 | 6062 |
| Total Assets | 12473 | 13841 | 15717 | Total Assets | 3441 | 3954 | 4379 |
| Net Margins | 12.87% | 12.12% | 11.17% | Net Margins | 10.41% | 8.92% | 8.22% |
| Asset Turnover | 1.21 | 1.22 | 1.23 | Asset Turnover | 1.32 | 1.31 | 1.38 |
| Financial Leverage | 1.77 | 1.68 | 1.66 | Financial Leverage | 1.99 | 1.93 | 1.92 |
| ROE | 27.45% | 24.79% | 22.86% | ROE | 27.37% | 22.50% | 21.79% |
| Avg ROE | 25.03% | 5 Yr Avg | 23.89% | ||||
Data Source: www.screener.com
As we can observe from the tables above, both the companies belong to the paint industry. As paint industry is considered as a stable industry, in both the companies we see stable ratios for Net Margins, Asset Turnover and Financial Leverage. Because of the stability and consistency in the value of all the three metrics, we find stable ROE in both cases.
But, if we observe the revenue figures with the Net Profit figures in both companies, Asian Paints clearly hold an edge over Berger Paints. Three-year average Net Margin for Berger paints is approximately 9%. The same figure for Asian Paints is approximately 12%. So, even though both the company have almost similar asset turns and financial leverage, superior net margins of Asian paints help them to generate a higher ROE compared to Berger Paints.
Similarly, we can find ROE of a few companies from a different industry and compare it with the above results. That will give us an idea about the competitive rivalry among the players of a particular industry. We also get a sense as to which industries have predictable metrics and which have unpredictable. Thereby, risk profiles of different companies in different industries are studied and return expectations are drawn commensurate to the risk present in different companies.
Criticism of ROE
Though hailed as probably the most accurate measure of a company’s efficiency, it has its share of criticism as well. There are a few scenarios where ROE may not be an easy thing to calculate. Moreover, there is ambiguity as to how to arrive at the correct measure of ROE. Let us, take each scenario at a time and contemplate:
- High Debt leading to High Financial Leverage:
As we have mentioned earlier, there are three levers to the measure of ROE-margins, asset turnovers, and leverage. Out of the three levers it is only the leverage which if kept high for a sustained period, will hurt ROE. In the other two levers, the higher the ratio, the better the ROE. The reason for this divergence is that a company cannot sustain its margins and asset turnovers for a long period if it keeps on mounting huge pile of debt. However, for a short period, a company can deliver extremely high ROE, as for that short period the equity requirements of the company go down due to the presence of huge debt. Hence, in such a scenario, ROE can be misleading for a short period of time. Investors must be aware of the fact and they better calculate Return on Invested Capital (ROIC) for the same period; as ROIC negates the effects of leverage.
- Excess cash on the Balance Sheet:
Experts have two different views on this aspect. The first group says that the company is a steward of capital and hence should earn an appropriate return on all capital on its Balance Sheet. The second group is of the view that the performance of ROE and the risk of capital allocation should be kept separately. We feel the point of view of the second group is much more logical and makes a lot of sense.
The goal of ROE is to understand how efficiently a company uses its equity. And we should just stick to that and leave aside the capital allocation matter. Thereby, we should strip any excess cash from the asset side of the Balance Sheet, and make the necessary downward revision in equity to balance asset side with the liability side on the Balance Sheet. We would like to explain it with the help of an example for further clarity:
Balance Sheet of A Ltd
| LIABILITIES | AMOUNT(Cr) | ASSETS | AMOUNT(Cr) |
| EQUITY | 40 | FIXED ASSETS | 40 |
| OTHER LIABILITIES | 60 | CURRENT ASSETS | 60 |
| TOTAL LIABILITIES | 100 | TOTAL ASSETS | 100 |
PAT for the year given is 10 Cr.
Now, prima facie, ROE is PAT/Equity = 10/40 =25%
But if we are told that in the Current Assets it is found that cash in hand includes Rs 10 Cr of excess cash.
Then, ideally, we should strip that cash from the Current Assets side and hence the revised current asset figure stands at 50 Cr. So, the total of the Asset side comes to 90 Cr. Similarly, to make liability side match with the asset side, we do a revision in equity, wherein 10 Cr is deducted from equity to arrive at the revised figures if 30 Cr for the equity and 90 Cr for the total of Liability side. So, even though, PAT remains the same at 10 Cr, we have a new Balance Sheet as below:
Revised Balance Sheet of A Ltd
| LIABILITIES | AMOUNT(CR) | ASSETS | AMOUNT(CR) |
| EQUITY | 30 | FIXED ASSETS | 40 |
| OTHER LIABILITIES | 60 | CURRENT ASSETS | 50 |
| TOTAL LIABILITIES | 90 | TOTAL ASSETS | 90 |
Now, ROE is PAT/Equity = 10/30 = 33.33%
What we observe is that, when we strip out the excess cash from the asset side of the balance sheet and make the necessary downward revision in the value of the equity to match the liability side with the asset side, the ROE increases. The reason for the same is that any excess cash which is lying free with the capital allocator will earn fewer returns compared to the capital allocated in the business. Hence, we should make the necessary adjustment as explained above to arrive at the operating efficiency of business.
- M&A Activities:
Mergers and acquisitions accounting rules make it mandatory for companies to merge their accounts with the target company, so for any company which has just made an acquisition, the ROE just after the acquisition may be misleading as the goodwill amount on the balance sheet has a bearing on the calculation of ROE. The best way to judge a company’s performance, while it is undertaking M&A activities, is to calculate:
a. ROE excluding goodwill (subtracting goodwill from equity)
b. ROE including goodwill.
Then we have to envisage as to whether the company will enter into a lot M&A activities in the future as well or it will continue to grow organically only. If the company is assumed to be putting more focus on organic growth than inorganic growth, then operating ROE which is the ROE without goodwill is a better measure of performance. But if a company is expected to keep on participating in M&A activities in the future, the better measure of performance for such a company would be ROE including goodwill.
Conclusion
Despite having its share of criticism, ROE is undoubtedly the most effective measure of a company’s operational performance. But as we have discussed above, one shouldn’t take the blanket rate of ROE for the purpose of analysis. We must be able to take into account the three levers of ROE and then judge how each lever is contributing in the value of the ROE.
ROE may be misleading due to the presence of high leverage, excess cash on the balance sheet or involvement of M&A activities. However, by making suitable adjustments to the ROE formula in each case, we do arrive at a reasonably correct figure so as to gauge the performance of the company.
Hope that clears the concept of ROE. If you have any doubts or query regarding ROE, please write on the comments section, we will be happy to take that up.